
Macro Minute: Week of August 12, 2024
I need to start with a few housekeeping items:
First, I must apologize for the gap in publications that happened from February until now. We had a website issue and then an issue with our Constant Contact. And the second thing I need to bring up is that this post is going to be longer and get in the weeds a bit. If you are not inclined to go down the rabbit hole with me, feel free to skip to the last couple of paragraphs. I always try and sum up my thoughts in a shorter form at the end.
With that out of the way, I want to cover what I think is happening on a larger scale in the US economy and markets. Starting back in the 1970’s and 1980’s, we faced a scenario of sky-high interest rates from the largest bout of inflation the United States has ever faced. The economy was much more dependent on the industrial cycle with its booms and busts. This is also a time when the baby boomer generation was in the household formation years of their lives and overall debt levels were low. Interest rates played a large role on the economy because as interest rates came down, there was a large part of the populace ready to step in to buy homes and jumpstart the economic engine.
As the market moved into the 1990’s, we began transitioning to a more technology and services driven economy. This decade could be described best by Alan Greenspan’s words of “irrational exuberance”. When describing the bubble that built in growth stocks, irrational is an apt word to describe it. Over this entire time, when the economy hit a slow down the prescribed solution was to cut interest rates. Because the aggregate debt level was not high as it is today, it worked. The extent of the bubble that grew in the Nasdaq 100 during the 1990s is hard to appreciate today; these were the annual returns:
- 1995: 42.54%
- 1996: 43.54%,
- 1997: 20.63%,
- 1998: 85.30%,
- 1999: 101.95%.
As you can see from these large returns the market was flying high.
The 2000’s is described as a lost decade because the S&P 500 had a negative 0.95% return over that time. This was a decade that began with an unwinding of the exuberance of the 1990’s and ended with the great financial crisis that unwound the exuberance in the housing market.
This was also the decade that gave rise to China becoming the dominant producer of goods in the world and the last time that international equities vastly outperformed US equities. This is the decade that a diversified portfolio handily outperformed a US large cap centric portfolio.
The 2010’s had a few themes that had big impacts on markets. After the great financial crisis, we entered into the ultimate dominance of central banking around the world. Central banks not only pegged interest rates very low, but they expanded their balance sheet through quantitative easing (QE) programs. This happened at a time, when at the beginning of the decade, government spending was being curtailed with austerity measures. In the United States, we had the Tea Party movement grow in popularity, and in the European Union, there was a large pullback in spending. This led to appreciation in financial assets due to central bank balance sheet expansion and a period of low economic growth due to austerity measures. This decade was also a period of extremely low volatility in capital markets because of the dominance of central bank policies.
I am proposing that this whole playbook of the Federal Reserve policies that dominated capital markets the previous 40 years changed beginning in 2020. Monetary Policy has taken many different forms through the years, from lowering rates to directly injecting money into the banking system. This changed in the aftermath of COVID. When we look at how that crisis was met, it was not only Monetary Policy, but Fiscal Policy that was implemented. Monetary did its normal playbook by lowering rates and buying financial assets, but that does not really help someone who has been told not to go in to work and who does not know when they will be able to go back to work. So, fiscal stepped in to fill the gap. We sent money to every household, we gave large loans to businesses that were later forgiven, we sent money to the states and boosted unemployment benefits.
All told, in the US alone, $5.9 trillion dollars of fiscal aid was created and $4.7 trillion in monetary aid was given.
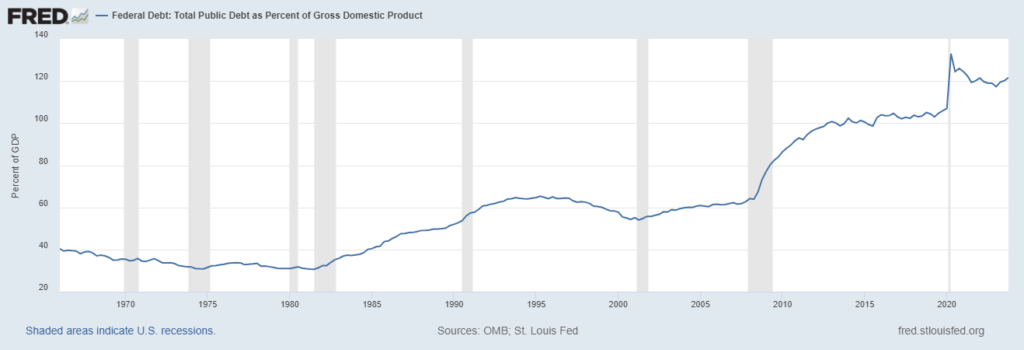
It is important to keep in mind the above chart of debt to GDP. As we have progressed over time, we have amassed more and more debt and spending. The government could carry this because interest rates fell in a similar fashion over the same time.
Think of it this way: if you were spending more than your income and used debt to spend, the only way that is sustained is by your interest expense going down in lock step with your spending going up. That is similar to what has been going on in the United States – the interest expense on that debt has not been a problem until recently because the interest rates have been falling or held low.
We have now racked up over 100% of debt to GDP. Not only that, but the government spent $1.7 trillion more than they received in 2023 and the Congressional Budget Office (CBO) projects deficits out for the next decade.
The term that is being thrown around for this environment is fiscal dominance because fiscal policy has an outsized impact on the economy and markets. This is an environment that will have different outcomes from the prior cycle. As an investor in the previous environment, you needed to watch what the central bank policies were and invest accordingly. In this new environment, the central bank will increasingly take a back seat to what government spending is doing.
I will try and give some thoughts around what I think this cycle will be like. I think that as long as fiscal spending continues, economic slowdowns will be rare. Government spending at these levels is extremely stimulating to the economy. The government liabilities are the private sectors’ assets. An example of this is Social Security. That is a liability for the government, but that becomes cash for the recipient. The things to look at for an economic slowdown is if governments start talking about cutting spending. This will be very difficult to achieve under the current political system in the United States. Regardless of the political party in power, the spending seems to continue. The only difference appears to be on what it is spent on.
Another characteristic should be a cycle of appreciation in real assets. My reason for this is because if government spending continues at this pace, the Treasury will have to continue to grow its treasury issuance. In an effort to keep interest rates from rising too far too fast, the federal reserve or the banking system, will be pressured into buying more and more of that issuance. Monetizing the debt in this fashion debases the currency versus assets.
Stocks and bonds will increasingly trade together. Over the last 40 years when stocks went down, bonds would go up because of rate cuts. In this new environment – where we have already seen this play out- stocks and bonds will tend to trade in the same direction. This means that investors will need to hold different assets to help shield against stock selloffs. I personally like real assets and managed futures.
I am just wanting to get a message out about how I believe that we have entered into a new economic environment and that will have different rules. In the 2010s we had a hard time getting inflation above 2%. In this decade we may have a hard time getting inflation under 2%. In this environment we will need to increasingly watch government spending over Federal Reserve policies. When government debt gets to be this size of GDP, the government has only a couple of options to get that ratio lower.
One way is to cut government spending and to date we have seen little appetite for this option. The other option is to hold interest rates below the rate of inflation which is also known as negative real rates. This tends to be the preferred method with less political ramifications. If they can manufacture a slight negative real rate for a prolonged period of time the debt is inflated away. Real assets do really well in this scenario because the currency loses its value while these tangible assets do not. The most common example of this is gold.
As we move into this economic cycle, it is important to recognize that what has worked before may be less effective now. I have identified some of the characteristics I believe will be in this new cycle and are often some of the things that I think about these days.
I hope that you find comfort in knowing how I am thinking about this current environment and, for our clients, how I am trying to position portfolios.
DISCLOSURES:
Please remember that past performance may not be indicative of future results. Different types of investments involve varying degrees of risk, and there can be no assurance that the future performance of any specific investment, investment strategy, or product (including the investments and/or investment strategies recommended or undertaken by Longview Financial Advisors, Inc.), or any non-investment related content, made reference to directly or indirectly in this newsletter will be profitable, equal any corresponding indicated historical performance level(s), be suitable for your portfolio or individual situation, or prove successful. Due to various factors, including changing market conditions and/or applicable laws, the content may no longer be reflective of current opinions or positions. Moreover, you should not assume that any discussion or information contained in this newsletter serves as the receipt of, or as a substitute for, personalized investment advice from Longview Financial Advisors, Inc. To the extent that a reader has any questions regarding the applicability of any specific issue discussed above to his/her individual situation, he/she is encouraged to consult with the professional advisor of his/her choosing. Longview Financial Advisors, Inc. is neither a law firm nor a certified public accounting firm and no portion of the newsletter content should be construed as legal or accounting advice. A copy of the Longview Financial Advisors, Inc.’s current written disclosure statement discussing our advisory services and fees is available upon request.