Macro Minute: Week of January 20, 2025
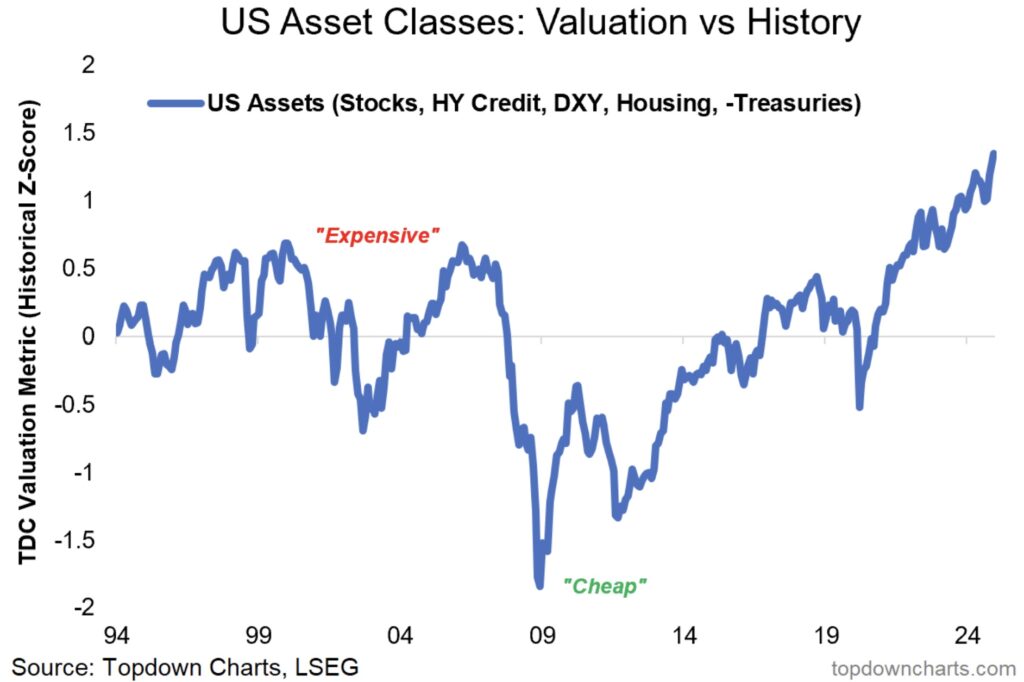
This week I want to discuss something that has been hitting me in the face more and more. I have been seeing charts discussing how expensive the stock market has gotten. The first graph I want to show is from Callum Thomas, who wrote a very interesting article on how in his interpretation the U.S. is now more overvalued than it was in 2007 or 1999. Here is the link to that writing. Now let’s look at this chart.

In looking at this chart we must realize that Callum is considering more than just stock valuations. He is looking and the value of high yield credit, dollar currency, housing prices, and U.S. government debt values. If I were to name this chart I would call it U.S. exceptionalism. In many ways the U.S. has gotten very expensive in multiple measures since the pandemic in 2020. There are many reasons for this that I’ve talked about before. The question is, now that we have gotten to this point, what does it mean for assets? One critique someone could make is the inclusion of housing prices in this chart. The dynamics likely to play out there are very different from some other assets. Many, myself included, do not believe we will have a housing value decline similar to what is seen in the other markets included on the chart. This is primarily due to demographics, along with an undersupply of houses being built. In other words, the millennial generation is in its household formation years and even though the prices are high (along with mortgage rates), they will still be looking to purchase a home. People buy homes for many reasons other than as an investment, many do not even considerate it one, and therefore the large increase in home prices seen in 2021-2022 will likely remain.
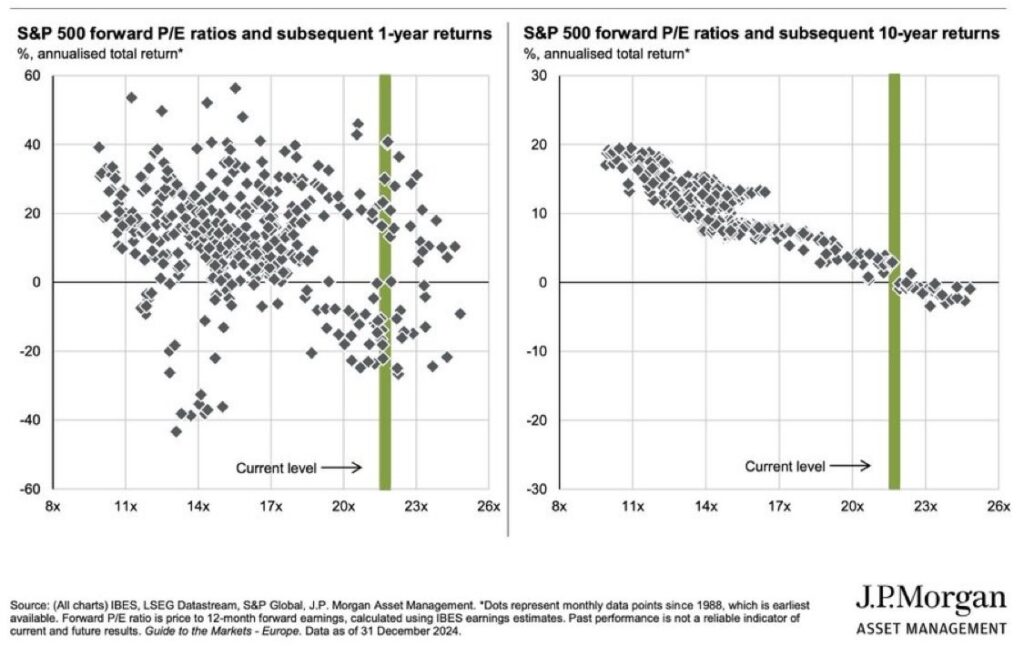
Getting back to what we should do about stock valuations, I want to bring in another chart. This is a chart from J.P. Morgan.

Let me break down this chart, because as an asset allocator, it is highly illuminating. The chart on the left represents the one-year forward returns achieved by the S&P 500 since 1988 and the P/E ratio of the index. As you can see, there is no discernable pattern that can be found over one year because the index is expensive. The green bar represents the current P/E ratio and historically what has happened. In the past at these levels, the return has been anywhere from about 40% to -25% on a one-year forward basis. Again, no forecastable intelligence in the data. However, when you do the same exercise looking at a forward 10-year return a pattern emerges. The chart on the right is the same as the left, except it shows the 10-year forward returns since 1988 for a given P/E ratio of the S&P 500. What can be inferred here is that the more expensive the P/E ratio the lower the expected 10-year return. The current valuation historically has indicated a pretty benign return over the next 10 years.
I would like to enter one more thing to consider before we all get down and gloomy about the next decade. The work of 3Fourteen Research and Warren Pies brings some very convincing data to the table. They break down the sector composition weighting of the S&P 500 over time and conclude that the heavy weighting toward tech and information technology garners a higher P/E ratio. In other words, if you account for the typical sector P/E ratios through time and apply that to the current higher tech weighting, you get a market that is more fairly priced instead of overvalued.
When I add all of this together, I conclude a few things. The U.S. is historically expensive versus the rest of the world. Parts of the U.S. market are inexpensive, just not when taken as a whole. Even given the high valuation compared to history, the shorter-term returns could still be okay. Because of the high valuation, now is not a time to abandon the less expensive (aka the things that have not grown as much) parts of your portfolio. Remain diversified with a focus on the longer-term.
DISCLOSURES:
Please remember that past performance is no guarantee of future results. Different types of investments involve varying degrees of risk, and there can be no assurance that the future performance of any specific investment, investment strategy, or product (including the investments and/or investment strategies recommended or undertaken by Longview Financial Advisors, Inc. [“Longview”]), or any non-investment related content, made reference to directly or indirectly in this commentary will be profitable, equal any corresponding indicated historical performance level(s), be suitable for your portfolio or individual situation, or prove successful. Due to various factors, including changing market conditions and/or applicable laws, the content may no longer be reflective of current opinions or positions. Moreover, no portion of this discussion or information serves as the receipt of, or a substitute for, personalized investment advice from Longview. Neither Longview’s investment adviser registration status, nor any amount of prior experience or success, should be construed that a certain level of results or satisfaction will be achieved if Longview is engaged, or continues to be engaged, to provide investment advisory services. Longview is neither a law firm, nor a certified public accounting firm, and no portion of the commentary content should be construed as legal or accounting advice. A copy of the Longview’s current written disclosure Brochure discussing our advisory services and fees continues to remain available upon request or at https://longviewfa.com/. Please Remember: If you are a Longview client, please contact Longview, in writing, if there are any changes in your personal/financial situation or investment objectives for the purpose of reviewing/evaluating/revising our previous recommendations and/or services, or if you would like to impose, add, or to modify any reasonable restrictions to our investment advisory services. Unless, and until, you notify us, in writing, to the contrary, we shall continue to provide services as we do currently. Please Also Remember to advise us if you have not been receiving account statements (at least quarterly) from the account custodian